
02: tie up farming
ag-tech for old habits.
in designing behaviour for the long term, incremental change is a powerful tool. starting small we do not rely on huge amounts of motivation, and things seem doable.
ratchet up these tiny progressions, you can lead users into more complex involvement.
ya can't get my dad to record anything 'coz he's old school.’
- the broad-acre farmer's son
let’s start with baby steps.

beginning
in their field.
tie up farming is a cloud saas farm management platform for production horticulturalists. an end-to-end software solution, split into stand alone modules that can be procured separately or as a complete system for labour-intensive agri-business management, and recording regulatory and quality assurance data.
our brief was to research and develop a chemicals and fertilisers inventory management module anchored at the top level by commonality of inclusions for farms of all sizes. the solution needed to streamline administration of inventory and stocktake operations, provide real-time information, and link to an existing spray diary module of the saas platform.
consideration needed to be given to inspiring greater uptake of the module in a traditionally paper and pen market, and elevating the role agronomists play in the process, to integrate their recommendations and mitigate double-handling of their workload.

knowing the sod.
straight up! we are not farmers, and we were not going to start pretending we knew the first thing about working on the land.
with our laptops as remote harvesters, we rode up and down the lines of desktop research, reviewing agri-business governance and regulatory requirements for handling farm chemicals, orientating ourselves with software licensing and delivery models [saas] and pulling together an overview of saas farm management solutions, which could be expanded on in competitive analysis.
to bring in good data we also needed to learn the lingo. familiarity with the vocabulary enabled us to conduct meaningful interviews with experts in the field - farmers and agronomists - and gave credence to our small team of city slickers and our design objectives.
[a good inventory management system] considers all the variables in type of agri-business. a system that splinters out like a tree, adding complexity.’
— roei yaakobi, CEO, tie up farming

crop scouting.
the task of identifying commonality in chemical and fertiliser inventory management systems [ims] across the gamut of production horticulture, required the voice of the experts in the field to be heard: from the market gardener, to farm and inventory managers of broad-acre and intensive production agriculture.
we wanted to understand their motivations and deterrents, the influences on their agronomy and chemical inventory decision making, along with their activity and records priorities and competing tasks out on the field. we needed to know when pen&paper inventory management became untenable.
under strict national COVID19 lockdown measures, our greatest hurdle was a lack of contextual inquiry, especially considering the hands-on nature of the work of our users. in an attempt to yield enough actionable data that was specific and provided background, we captured the sentiments and characters of our interviewees in detailed empathy mapping during extended, loosely structured group video conferencing sessions.
middle
save me from excel!’
zoe, inventory superviser, aspiring agronomist

a mile in their blundstones.
as designers often create for people unlike themselves, empathy, the ability to recognise and share our user’s mental states, is the linchpin of human-centered design.
the ability to cognise and enter into someone else’s frame of mind is how we transcend disparity between designer and end-user. this is achieved by connecting with the user through a variety of investigative activities including interviews, observation and role play.
empathy mapping is one such tool of the trade. used to gain deeper insights into what our end user is thinking, doing, saying, hearing and feeling. dedicated notes were taken during interviews and these observations were synthesised in affinity diagraming. the resulting insights informed and gave reason for the design choices we made.

sowing.
phrasing insights as how might we questions or brief job stories, turn the challenges we uncover during user-research, into opportunities for design. these seed questions and statements are broad enough to accommodate a wide range of solutions but narrow enough that the team has some helpful boundaries; a perfect frame for functional design thinking.
the job stories we composed helped stimulate more discussion around the needs and wants of our end users. by framing the user within a contextually relevant story we were able to find commonality along different journeys and task intentions, across a divergent scope of agri-business. this temporal role-play was used as a tool to transport us into the mind-set of the end user, to illustrate facts, stir emotions and ultimately address uncertainty as we progressed from ideation into realisation. it also served to distinguish the target audience, the early adopters of a cloud-based ims.
separating the wheat from the chaff.
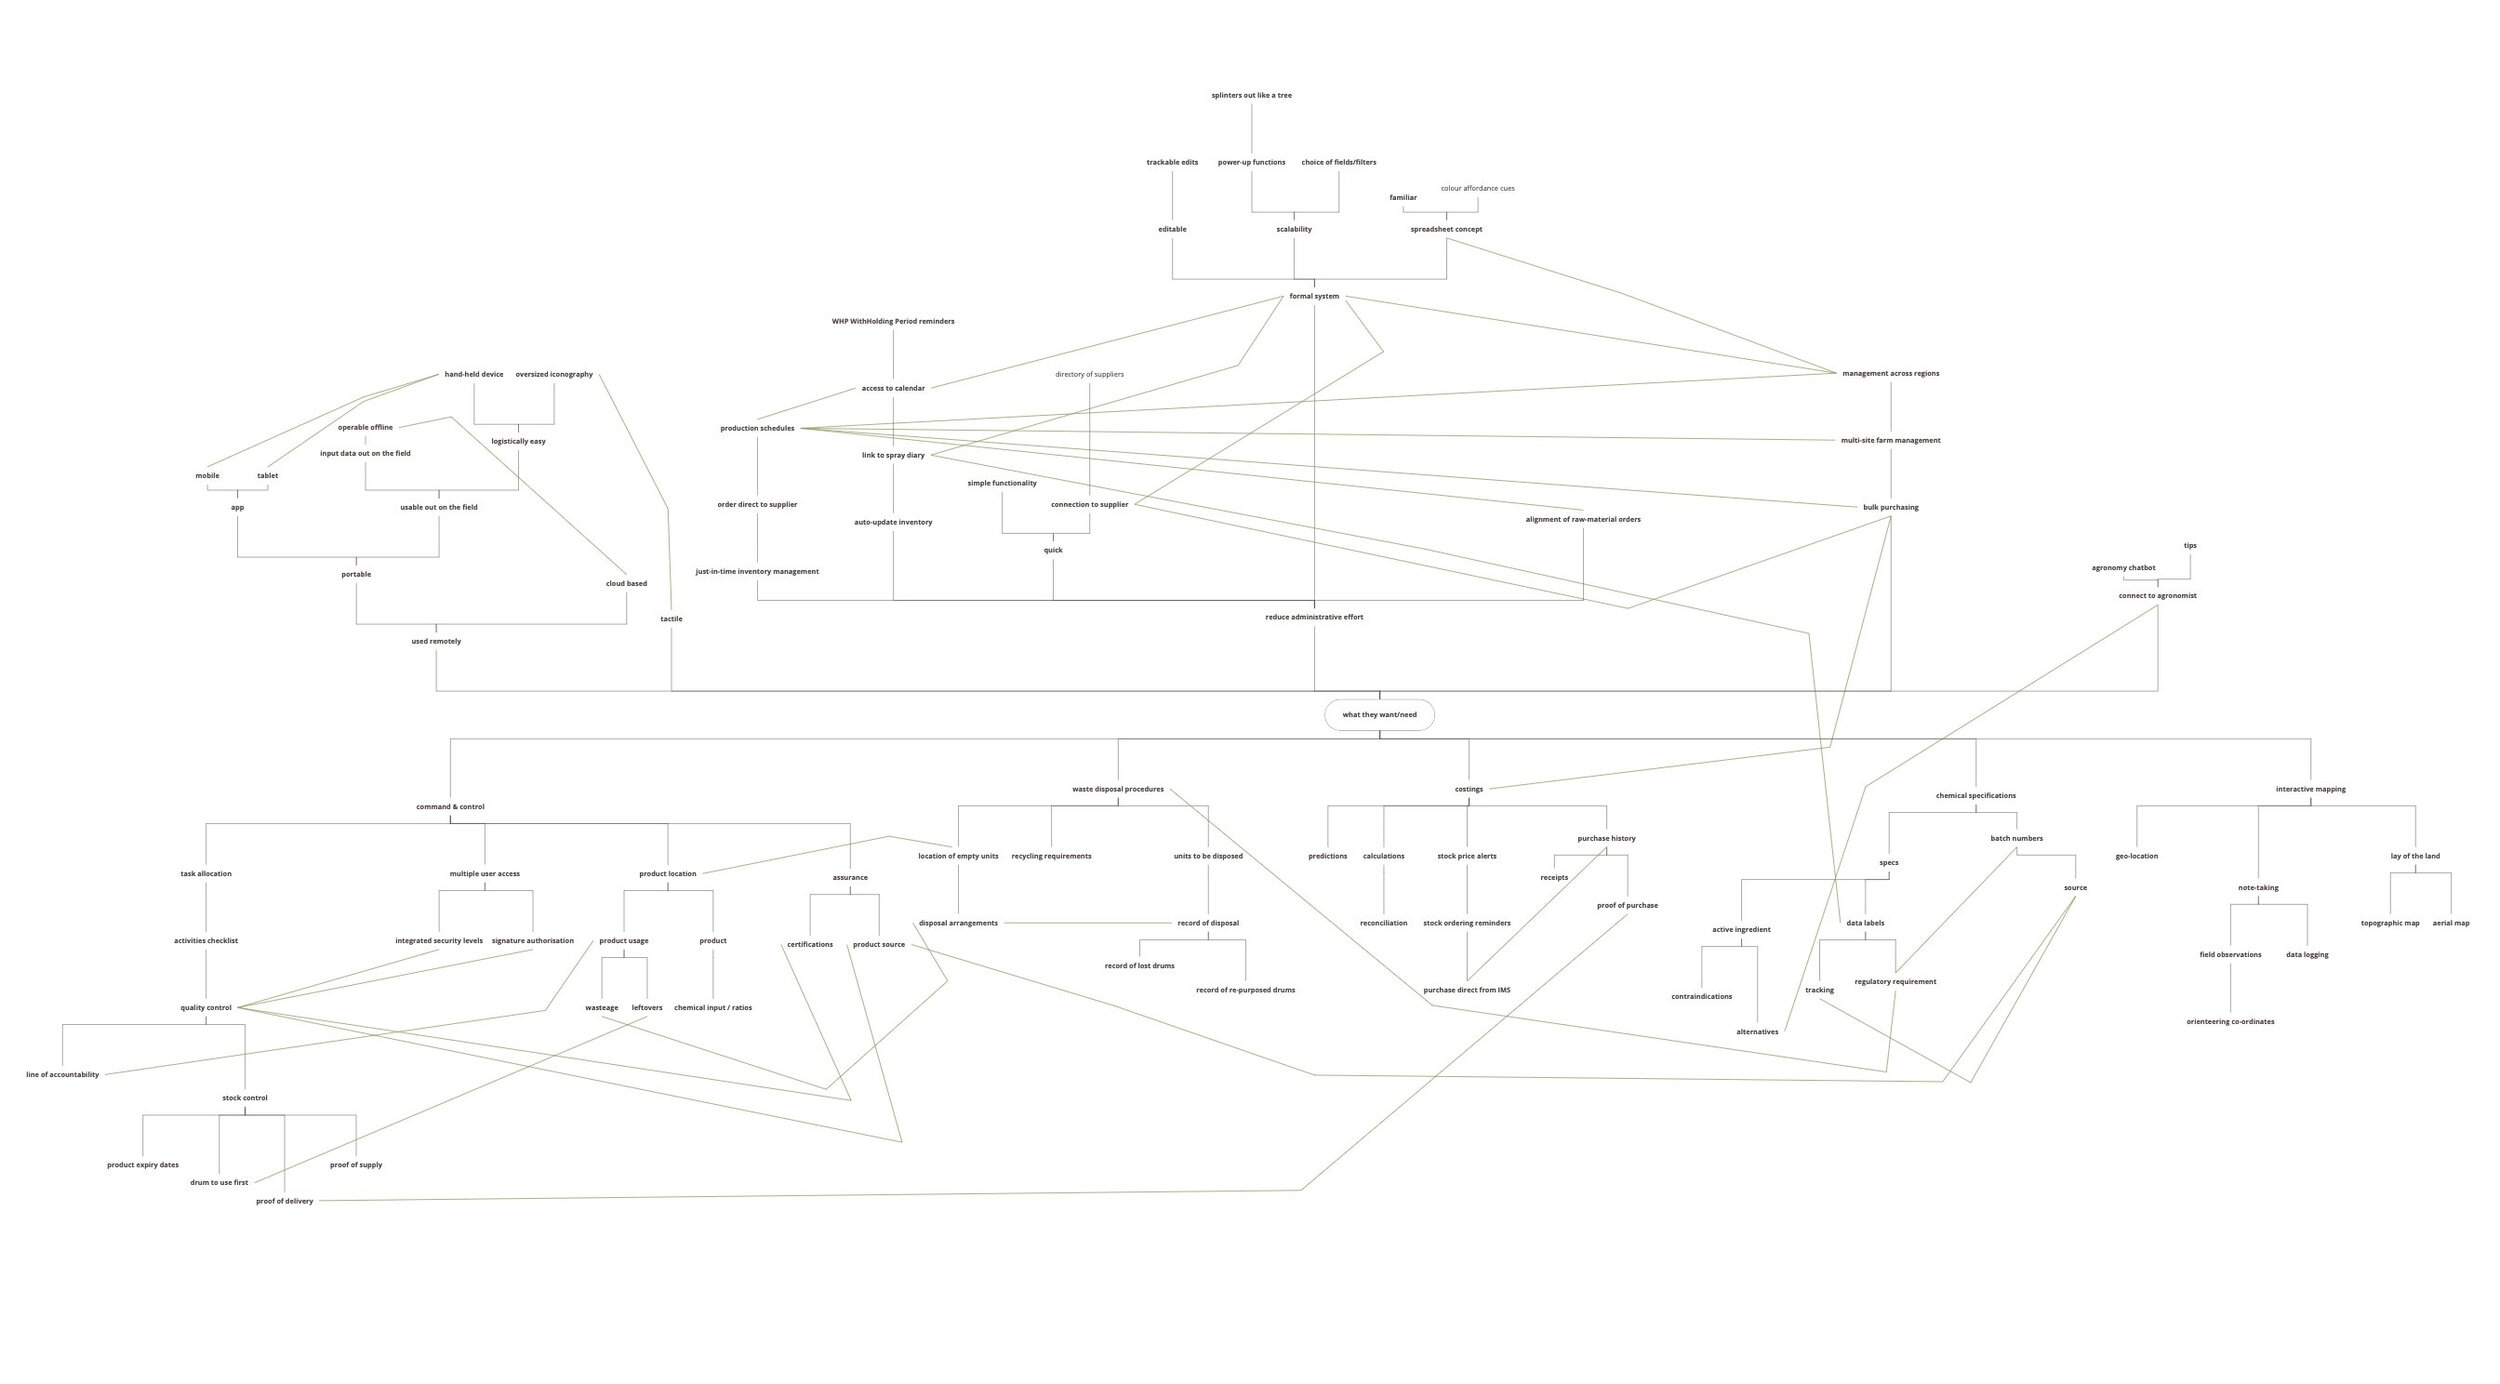
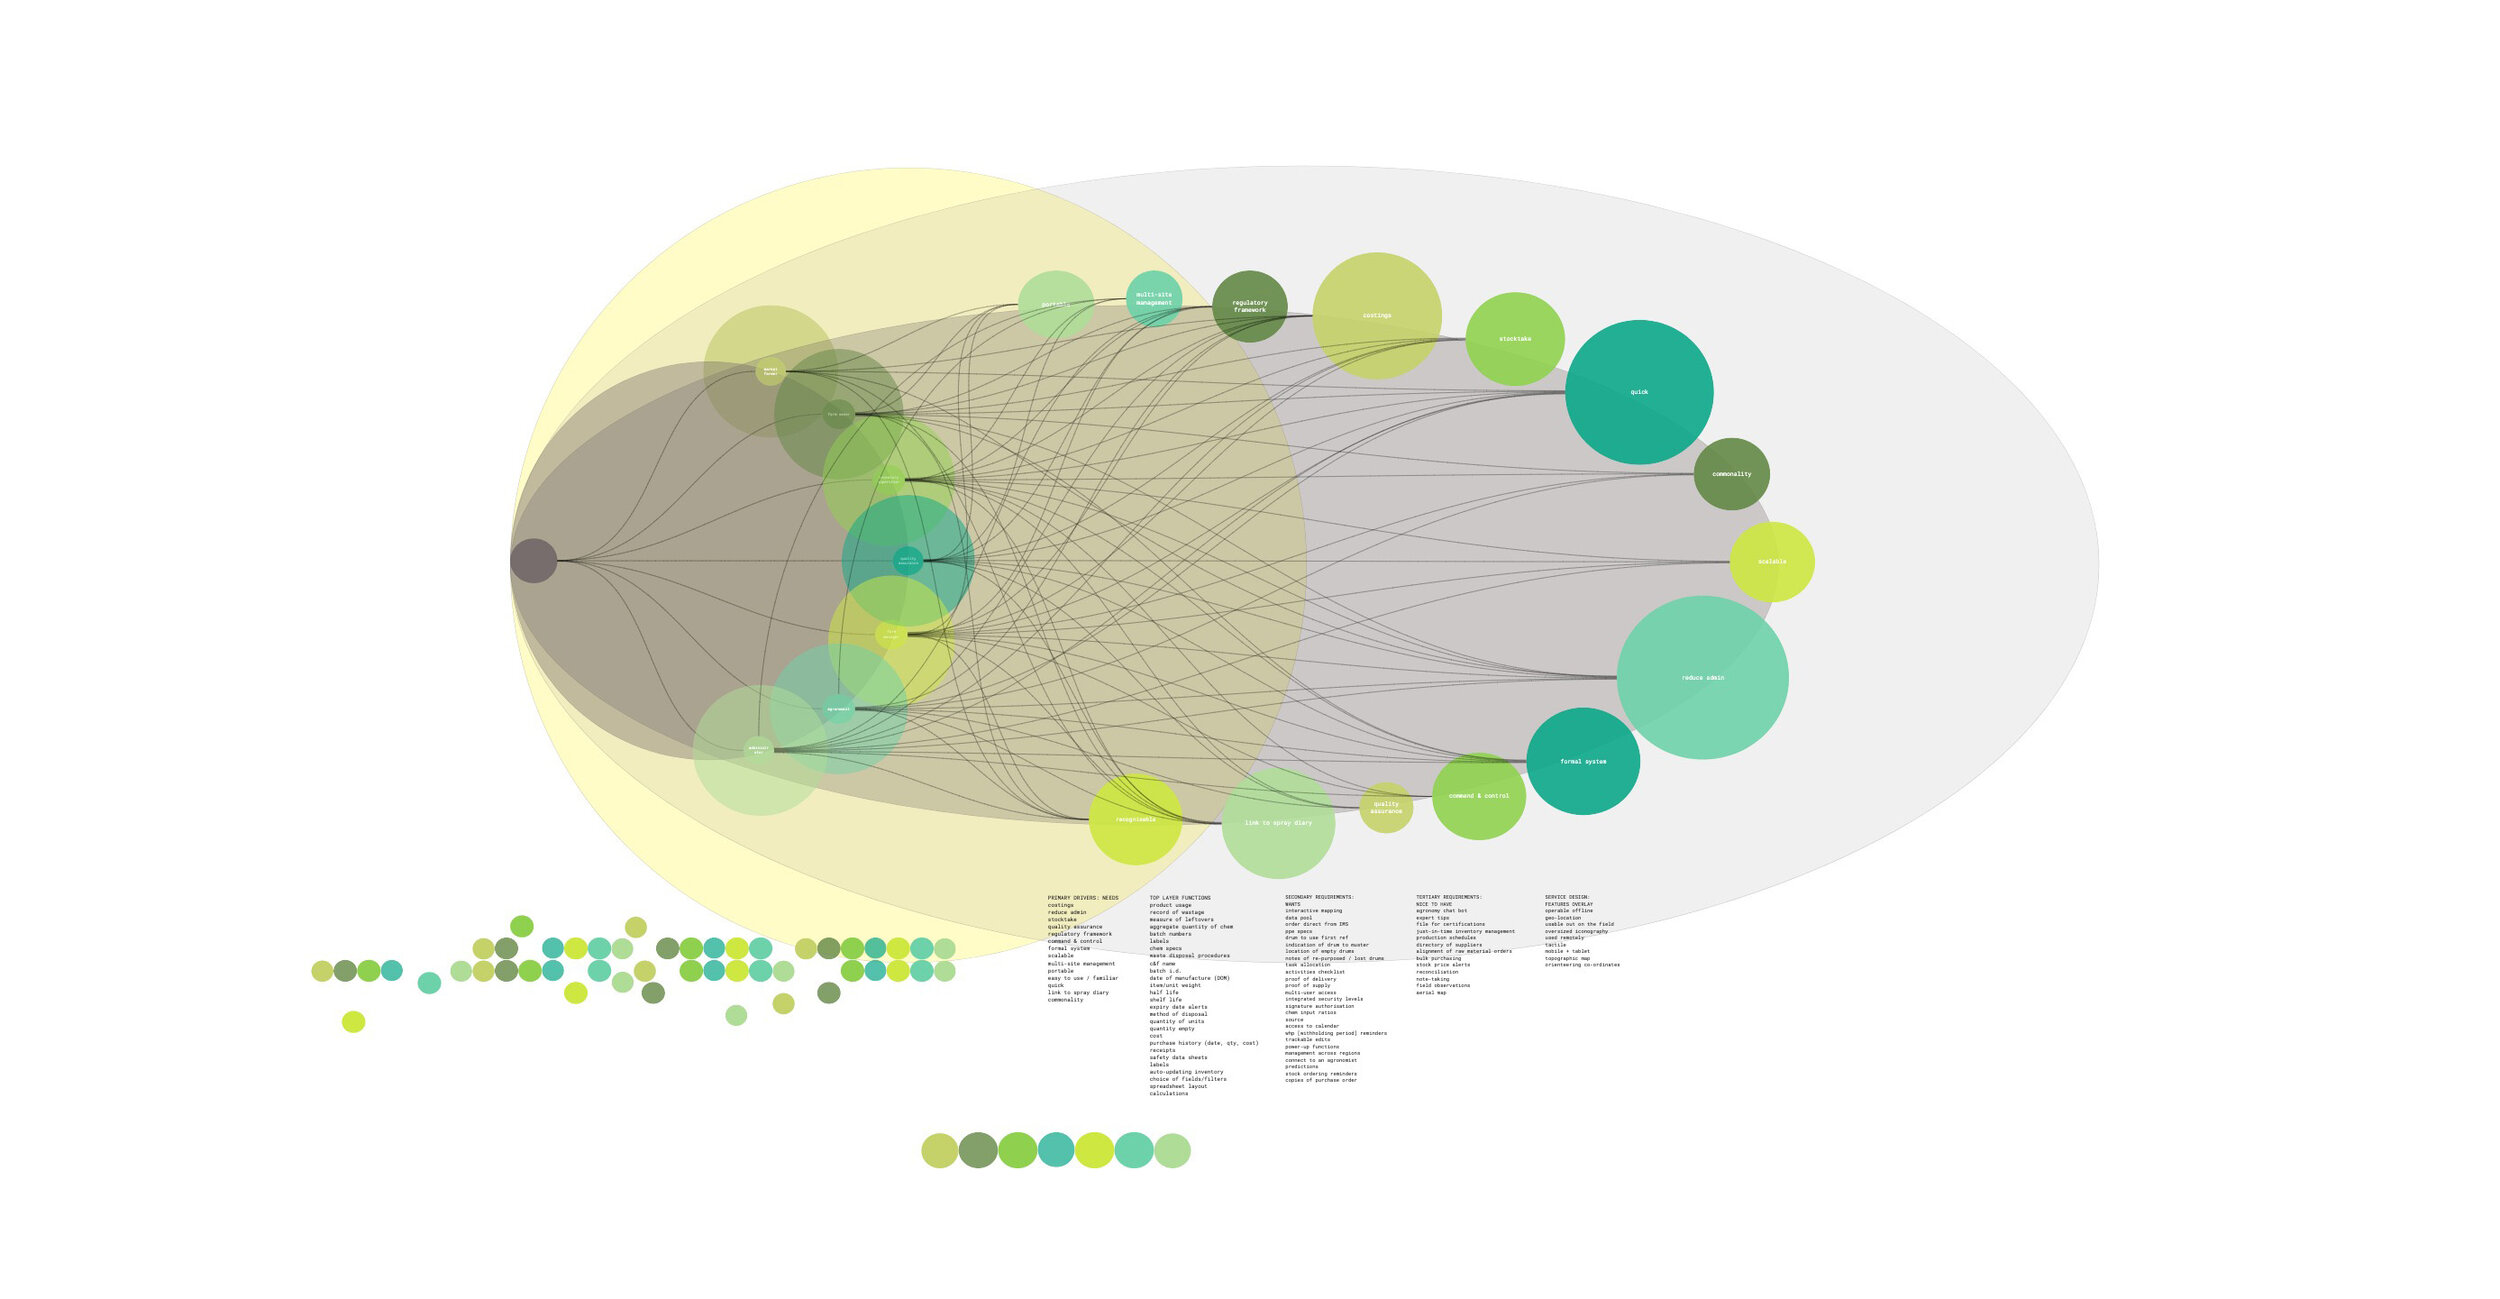
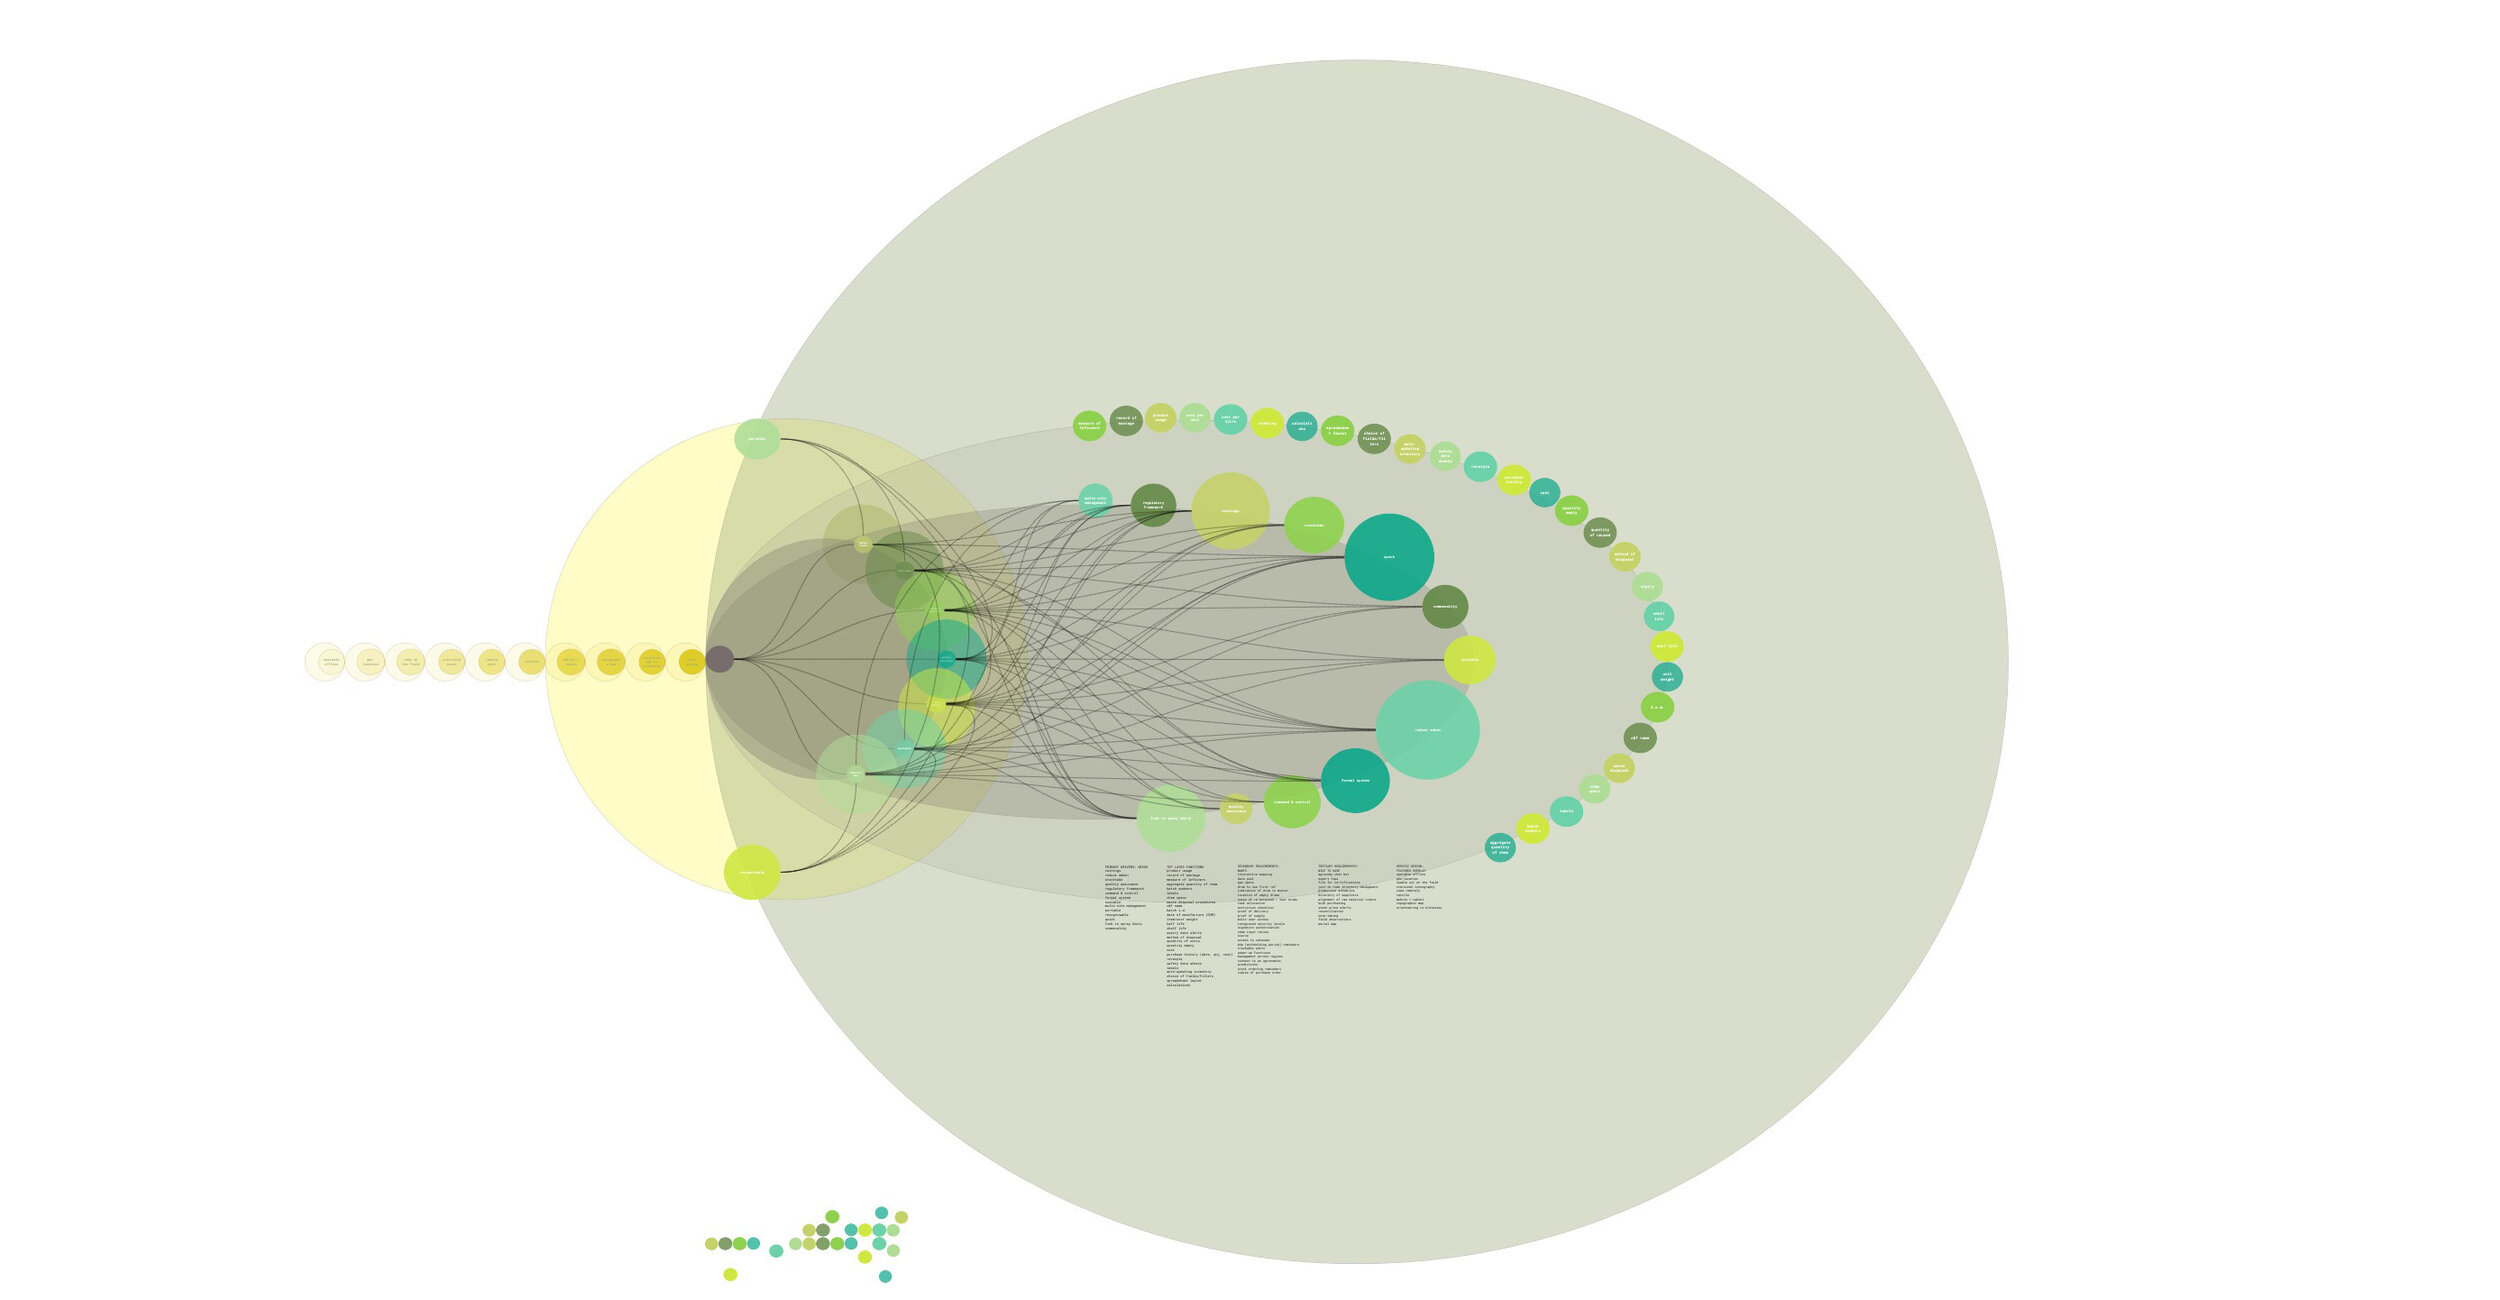
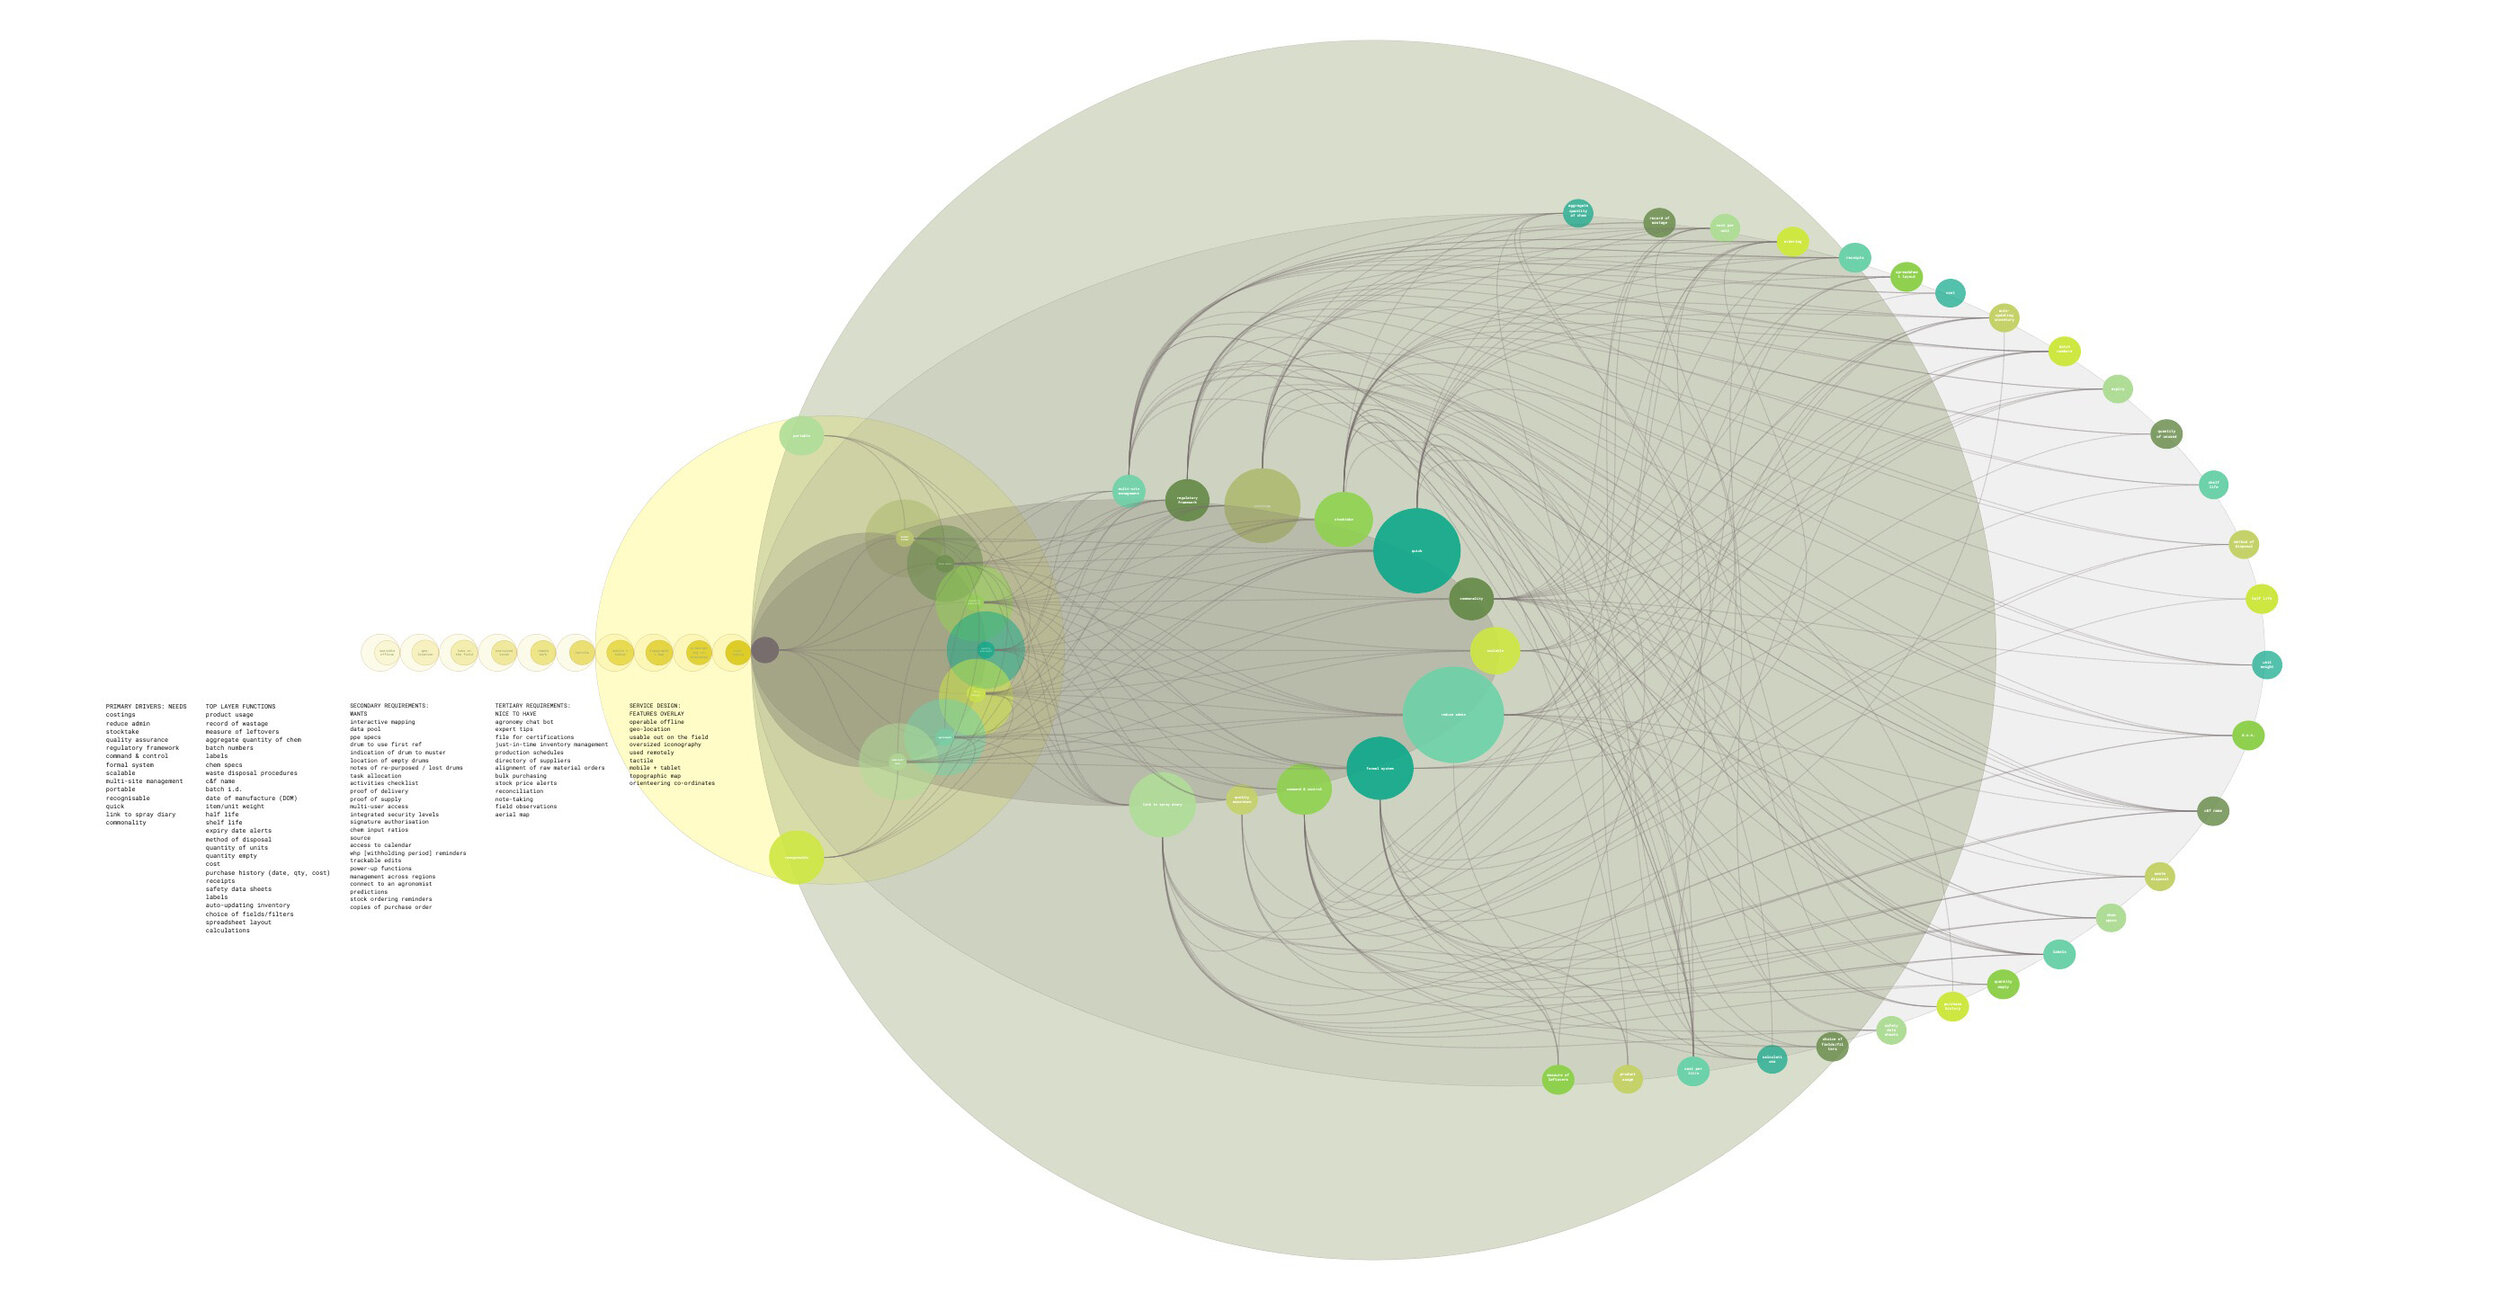
consuming large data sets and then discerning anything useful from them isn’t always straightforward. data visualisations are a form of visual art that grabs our interest with colour and patterns, and keeps our eyes on the message. they come into their own when information needs to be interpreted immediately.
data visualisation is a lot more than beautiful visuals; it’s about a thorough understanding of the audience and their needs, and finding the best way to communicate valuable information.
data visualisations are not only graphical representations of information, they are a great aid in analysing and making data-driven decisions and planning the information architecture. transforming our user research into visual demonstrations illustrated how the wants and needs of our farmers met on common ground and branched out, and where viability and value converged for the optimal product.
end
bearing fruit.
usability tests that give you meaningful information about how users interact with the prototype and what problems they face along the way, need to be planned based on the usability factors you wish to examine.
since our prototype was an incomplete product, we conducted moderated usability testing so we were available to answer questions our testers had, and witness for ourselves the instances of friction and failure they encountered and observe how the tester navigated their way. we used these light contextual interactions as another opportunity to take notes for direction in future builds.

it isn’t a mystery that a large part of delivering a highly successful user experience is understanding what the user wants/needs along with the cognition that consequently gets users thinking about what they want/need.’
- fabricio teixeira, ux collective
the business end of a combine.
if people are not able to perform their desired tasks efficiently, it doesn’t matter how great your product or site looks or how seamless its interactions, you are submitting to inevitable product failure. doing user research is equally as [arguably more] important as designing your product’s visual identity and interactions.
elevating agronomists
agronomists are specialists so we value them highly.’
- farm owner
the role of agronomists was elevated by understanding their explicit value in the planning of tasks and purchasing of products. this presented an opportunity to connect the exisiting spray diary with our c&f inventory management module, by having a place to load agronomy recommendations and upcoming tasks, and product requirements.
familiar format
we noted high levels of distrust in the unfamiliar and reluctance to change to new systems for the day-to-day management of farms. this stalwartness to the familiar fuelled debate around functional content designing and the potential to lean on the mantle of skeuomorphism to make it easier for these users to learn and convert to new tech.
procedural
chem inventory should include correct disposal procedures and records of disposal [of drums]; it's a regulatory exercise.’
- inventory supervisor

human-centered
given the physical and often hazardous work farmers do, their safety gear, and the exposure to climatic and topographic conditions working out on the land, it was inevitable that a broader human centered design context be examined too. during interviewing our users expressed concerns about offline capability, and the need for a tactile interface design, up-sized iconography, qr code readers, and the potential for imbedded geo-location functionality.
reducing cognitive load
with the knowledge that our users have many priority tasks competing for their attention and time, the top page was designed to provide overall figures at an order level. at a quick glance administrators can make comparisons on previous orders, identification of wastage and disposal, and tracking of expenditure. applying traffic-light colour coding to flag whether immediate action is required, further reduced the demand on cognition.
micro-economics
to address economies of scale, extensibility was designed into both directions of the product. power-up filters and functionality enabled users to customise their experience, whilst linkage to other platform modules and agronomist’s advice would drive greater procurement of the product suite for the client.

streamlined admin
it is time consuming and clumsy using a system where related data is entered separately, where one doesn't link or automatically update the other.’
- agronomist
both the perceived and actual load of administrative work was a barrier preventing farmers from using new inventory management systems, so for a better uptake of c&f inventory management in saas format, administratively heavy processes would need to be streamlined through automation and/or data pools.
quality assurance
it is important that the right batch is used so if you give directives to use the stock you know that batch number is being used up first.’
- broad-acre farm manager
as there could be more than one brand with the same active ingredient, the aggregate level of the active ingredient was required to be available with one click, and batch numbers for source tracing and quality assurance purposes needed to be readily accessible.
command and control
there needs to be a chain of command for security and quality control, and the ability to trace back to staff and source.’
- corporate farm ceo
early adoption
during our systematic research spanning the market gardener to large-scale corporate agri-businesses, we discovered it is not the size of the producer, moreover the level of labour intensity, that is the tipping point of needfulness of a saas ims. this needfulness was the flag bearer of early adopters; a critical insight for our client’s product and marketing strategies.

harvest.
user research is an essential ingredient in product strategy.
user research enables valuable, efficient, learnable interaction experiences. looking deeply into how people think and act you can discover and analyse users’ behaviour, needs, and motivations. these insights contribute to context and identifying product requirements, and is a non-negotiable in creating an optimal product for users.
our team dedicated considerable time knee-deep in our farmer’s gumboots to be able to write into our wireframes their shared fundamental requirements for a usable, desirable chemicals and fertilisers inventory management system. after many, long conversations with them, we were well versed in the language they spoke, the information they needed first, the data they wanted captured, why chemical specification labels were a hot topic and batch numbers were a must-have accessory, what happens at a drum muster, how we could design concurrently for traditional and progressive mindsets, and what early adopters looked and sounded like.
user research eliminates unwarranted designer bias, it is necessary to identify problems and establish the facts you need to design with, and facilitates the transition of a new product or technology into the mainstream. a design team’s effort will be worth naught if you create an unwanted product.


epilogue
old mac donald.
familiar-yet-better-than-i-remember
a phenomenon of convergent evolution is mimicry, the superficial resemblance of two or more organisms to confer advantage
skeuomorphism in design borrows cues in palette, form and pathways from real-life, reducing the incline of the users’ learning curve and making new tech more familiar and comfortable. in employing this technique of mimicry we conferred advantage in usefulness and usability to the user, and simultaneously commercial acumen for the product owner. the execution of a product that lent on familiarity to invoke uptake, learning, and then greater reliance and trust in the product, mimicked existing methods of management and administration.
superficial resemblance in module layout and the use of simple colour affordance cues resulted in a readily learnable, usable and controllable interface to a naive, or reluctant, user.
a baby step towards more complex interactivity.

desktop researchstoryboardsurveycompetitor analysisempathy mappingvideo interviewssite visit actionable problem statementsjob storiesaffinity diagramrandomised word diagramdata visualisationlow-fi prototypingmoderated usability testingpresentation deck
mirogoogle formsg-suitezoomslackadobe premieregoogle sheetsotterfigmatableau public
networking cold-callingsketchingstakeholder managementcross-disciplinary collaborationclient liaisonbehavioural economycharacter studyreflectionemotional intelligencevisualisingdiagraming